Experimental investigation of nanoparticle dispersion by beads milling with centrifugal bead separation

Experimental investigation of nanoparticle dispersion by beads milling
with centrifugal bead separation
Mitsugi Inkyo a, Takashi Tahara a, Toru Iwaki b, Ferry Iskandar c, Christopher J. Hogan Jr. d,
Kikuo Okuyama c,∗
a Kotobuki Industries Co., Ltd., 1-2-43 Hiroshiratake, Kure, Hiroshima 737-0144, Japan
b Hiroshima Joint Research Center for Nanotechnology Particle Project, Japan Chemical Innovation Institute, 1-3-1 Kagamiyama,
Higashi-Hiroshima 739-8530, Japan
c Department of Chemical Engineering, Graduate School of Engineering, Hiroshima University, 1-4-1 Kagamiyama, Higashi-Hiroshima 739-8527, Japan
d Environmental Engineering Science Program, Washington University in Saint Louis, Campus Box 1180, One Brookings Dr., Saint Louis, MO 63132, USA
Received 29 June 2006; accepted 1 September 2006
Available online 15 September 2006
Abstract
A new type of beads mill for dispersing nanoparticles into liquids has been developed. The bead mill utilizes centrifugation to separate beads from nanoparticle suspensions and allows for the use of small sized beads (i.e. 15–30 μm in diameter). The performance of the beads mill in dispersing a suspension of titanium dioxide nanoparticle with 15 nm primary particles was evaluated experimentally. Dynamic light scattering was used to measure titania particle size distributions over time during the milling process, and bead sizes in the 15–100 μm range were used. It was found that larger beads (50–100 μm) were not capable of fully dispersing nanoparticles, and particles reagglomerated after long milling times. Smaller beads (15–30 μm) were capable of dispersing nanoparticles, and a sharp peak around 15 nm in the titania size distribution was visible when smaller beads were used. Because nanoparticle collisions with smaller beads have lower impact energy, it was found by X-ray diffraction and transmission electron microscopy that changes in nanoparticle crystallinity and morphology are minimized when smaller beads are used. Furthermore, inductively-coupled plasma spectroscopy was used to determine the level of bead contamination in the nanoparticle suspension during milling, and it was found that smaller beads are less likely to fragment and contaminate nanoparticle suspensions. The new type of beads mill is capable of effectively dispersing nanoparticle suspensions and will be extremely useful in future nanoparticle research.
© 2006 Elsevier Inc. All rights reserved.
Keywords: Nanoparticles; Dispersing machine; Dispersing process; Agglomeration; Beads mill; Media mill; Colloidal particles; Titania nanoparticles
1. Introduction
Nanoparticles in the 1–100 nm size range have remarkably different properties from bulk materials [1] and therefore have great potential for use in electronic, chemical, mechanical, and biological industries. For many nanoparticle applications, it is necessary form a stable colloidal nanoparticle suspension [2]. However, the surface energy of nanoparticles is significantly higher than that of larger particles; thus, nanoparticles tend to agglomerate in liquid suspensions [3,4]. Stable nanoparti-cle suspensions are often formed by adjusting the suspension ionic strength and pH [5] or by surface modification of the nanoparticles themselves [6,7]. In many applications, however, chemical additives are undesirable in the nanoparticle suspension. For example, spray-drying used for nanoparticle processing [8] requires relatively pure nanoparticle suspensions. The ionic strength of the solution can also influence the performance of nanoparticles as catalysts and is critical in processes such as nanoparticle electrospraying [9].
Mechanical milling processes are an alternative to chemical and surface modifications for making stable nanoparticle dispersions. Many mechanical processing methods have been developed for dispersing agglomerated particles in liquids, in-cluding agitator discs, colloid mills, high-pressure homogenizers, triple roller mills, ball mills, sand mills and beads mills [2,10]. Beads mills are used in industrial processing for grinding and dispersing agglomerated particles with primary particles in the submicrometer size range. Commercial beads mills currently utilize beads larger than 20 μm and have been unsuccessful in dispersing nanoparticles with particle sizes less than 20 nm [11]. Therefore, many nanoparticle dispersions, such as quantum dots [12,13], which have sub-20 nm primary particles, cannot be successfully dispersed by most beads mills. In addition, the large beads found in most beads mills (>20 μm diameter) give rise to high impact energies during the dispersion process, which could fragment the nanoparticles, alter nanoparticle crystallinity, and alter the nanoparticle surface such that particle agglomeration is favored after the milling process is complete [14–20].
The use of smaller beads in beads mills is necessary for effective nanoparticle agglomerate breakup and to prevent surface modification of nanoparticles during the milling process. The primary obstacle to the use of smaller beads is that smaller beads are difficult to separate from the nanoparticle suspension after milling is complete. For beads larger than 50 μm, several processes, such as filtration and centrifugation, can be used in beads mills to remove beads from dispersions [21]. However, other than the beads mill in our initial report [22], no beads mill/centrifugation equipment has been developed that is capable of using beads smaller than 50 μm, and no beads mill has been able to successfully disperse nanoparticles with primary particle sizes less than 20 nm (including our previous work).
Here, nanoparticle dispersion in a newly developed beads mill was experimentally investigated. The beads mill utilizes a centrifugation method such that bead particles with diameters of 15 μm can be used and separated from nanoparticle suspensions. The effect of bead size and milling time on the size distribution of a dispersion of titanium dioxide nanoparticles with nominal primary particle diameters of 15 nm was evaluated. Changes nanoparticle crystallinity and morphology due to milling, and amount of bead contamination in the nanoparticle suspension were also studied.
2. Materials and methods
2.1. Experimental procedures
A schematic of the beads mill is shown in Fig. 1. The apparatus consists of 0.2 L vessel, a pump for supplying the nanoparticle slurry, and a mixer tank. Slurry is pumped into the vessel of the beads mill, which contains the beads and centrifugation rotor. The lower portion (dispersing section) of the vessel is used to agitate the beads and break nanoparticle agglomerates, while the upper region (centrifugation section) is used for bead separation from the slurry. The vessel is enclosed in a cooling jacket to prevent temperature increases in the system, and is completely sealed from the outside environment.
The dispersion process in the beads mill is described as follows: The raw material slurry containing agglomerated particles is pumped into the dispersing section of the vessel at a mass flowrate of 10 kg/h, where it interacts with the violently agitated beads. Gradually, the slurry reaches the upper part of the dispersing region, where it is separated from the beads by centrifugal force. The beads remain inside the mill, while the nanoparticle slurry is pumped out of the vessel. The product particles are collected in the mixing tank and the dispersing process is repeated.
For all experiments, the peripheral speed of the rotor in the centrifugation section was fixed at 10 m/s. ZrO2(zirconia) beads (Nikkato Corp., Osaka, Japan) with sizes of 15, 30, 50, and 100 μm were used. The zirconia beads occupied 65% of the vessel volume. The slurry was composed of aqueous TiO2 (titania) nanoparticles (MT100AQ, nominal primary particle size of 15 nm, produced by Tayca Co., Ltd., Japan) where titania made up 10% of the slurry mass. Initially, the mean particle size of the agglomerated particles was 246 nm as measured by dynamic light scattering (DLS, Microtrack UPA150, Nikkiso Corp).
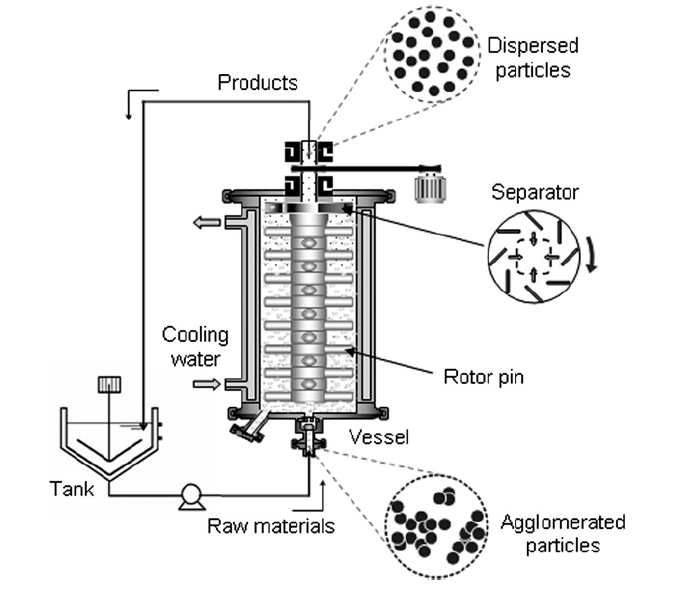
Fig.1 Schematic diagram of the beads mill.
2.2. Characterization
Titania particle size distributions were measured by DLS (Microtrack UPA150, Nikkiso Corp.) after milling times from 15 to 300 min. The crystallinity of the nanoparticles was measured using X-ray diffraction (XRD, RIGAKU, RINT2550 VHF). Particle morphology was examined visually using transmission electron microscopy (TEM, Japan Electron Optics Laboratory JEM-3000F). UV–vis-spectroscopy (UV-3150, Shimadzu) was also used to determine changes in particle size and morphology due to milling. Bead contamination in the nanoparticle slurry was determined by elemental analysis using inductively coupled plasma spectroscopy (ICPS-8100, Shimadzu Corp., Japan).
3. Results and discussion
3.1. Titania size distributions
Fig. 2 shows the size distributions of the titania particles as measured by DLS for the various beads sizes and processing times used. With all tested beads except the 15 μm size, the titania particle size distribution first shifted to smaller sizes, then gradually shifted back to larger sizes, indicating that agglomerate breakup occurred first, followed by reagglomeration as milling continued. Several researchers have proposed that reagglomeration occurs due to surface modification of particles during the grinding process [2,15]. Furthermore, agglomerate breakup significantly increases the number concentration of particles in the slurry, which in turn significantly reduces the characteristic coagulation time for particles [23].When 100 and 50 μm beads were used, not only did particles reagglomerate, but also the particle size distribution shifted from a unimodal distribution to a bimodal distribution for processing times larger than 240 min. This sudden change in the size distribution cannot be explained by any traditional particle agglomeration mechanisms [24]. One possible reason for the shift from a unimodal to bimodal size distribution is that agglomerated nanoparticles may have deposited on the beads themselves rather than breakup. After the nanoparticle deposits on the beads grew to a sufficiently large size, collisions may have caused nanoparticle deposits to break away from beads. The use of large beads was not the focus of this study, however, and the bimodal distributions found when 100 and 50 μm beads were used were not examined further.
Because agglomerate breakup was eventually followed by reagglomeration, there was a milling time for each bead size where the particle size distribution was minimized. Fig. 3 shows the minimum size distribution for each tested bead size with the milling time at which the distribution was measured indicated. 100 and 50 μm beads were not capable of completely breaking up nanoparticle agglomerates and had minimum size distributions where all particles were still agglomerated. 30 and 15 μm beads were able to completely breakup nanoparticle agglomerates and a sharp peak at 15 nm was apparent in the minimum particle size distributions for 30 and 15 μm beads. The milling time required to reach the minimum size distribution increased with decreasing bead size. Fig. 4 shows the particle size at 90 and 50% of the cumulative distribution (X0.9 and X0.5, respectively) as a function of dispersing time. The minimum X0.9 and X0.5 are indicated on the figure as well as the dispersing time at which the minimum occurred. Very little change in the X0.9 and X0.5 were evident for the 100 and 50 μm beads. A decrease in the X0.9 and X0.5 were apparent for 30 μm beads, however, reagglomeration over time caused the X0.9 and X0.5 to increase after longer dispersing times. Although the 15 μm beads required the longest time to reach a minimum in the X0.9 and X0.5, X0.9 and X0.5 did not substantially change with time after the minimum was reached, i.e. no reagglomeration was evident when 15 μm were used.
In addition to being able to completely disperse nanoparticles with sub-20 nm sizes, beads mills using smaller beads require less specific power (Sp) to disperse nanoparticles. For a dispersing power, P , dry solid weight, K, and dispersing time, t , Sp can be calculated as [22]:
Sp = Pt/K. (1)
The number concentration, dispersing power and impulsive power of all tested beads is shown in Table 1. Larger beads have greater dispersing power and impulsive power per bead, but lower number concentrations in the beads mill. The X0.9 and X0.5 values of the cumulative titania size distributions as a function of specific power are shown in Fig. 5. For 15 μm beads, the minimum X0.5 was reached at a specific power two times lower than specific power required to reach the minimum with 30 μm beads, indicating the smaller beads can perform the same work as larger beads with a lower energy input. Similar results have been observed by Kwade [14] for a stirred ball mill.
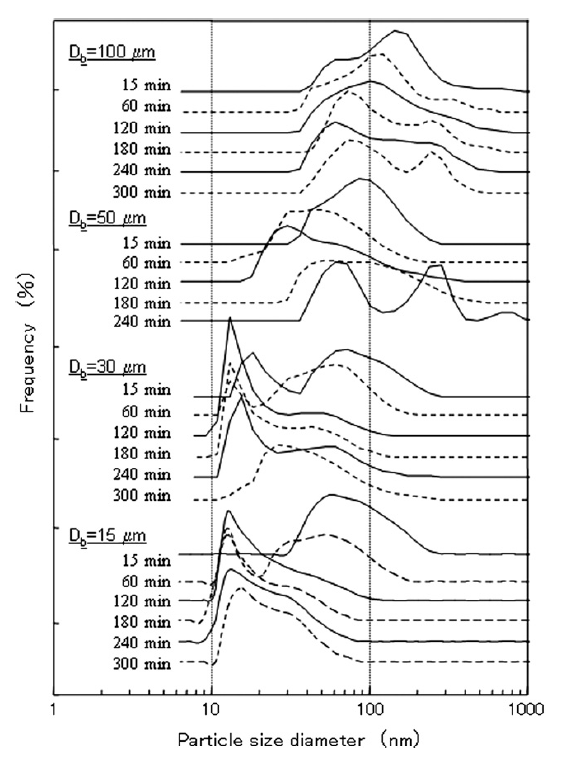
Fig.2 Particle size distributions for different sized beads and different dispersing times.
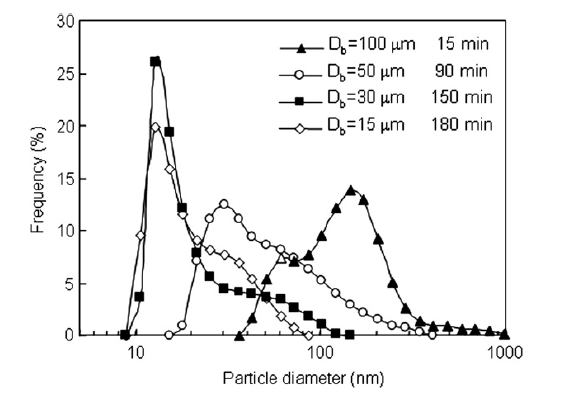
Fig.3 Minimum particle size distributions for each bead size examined.
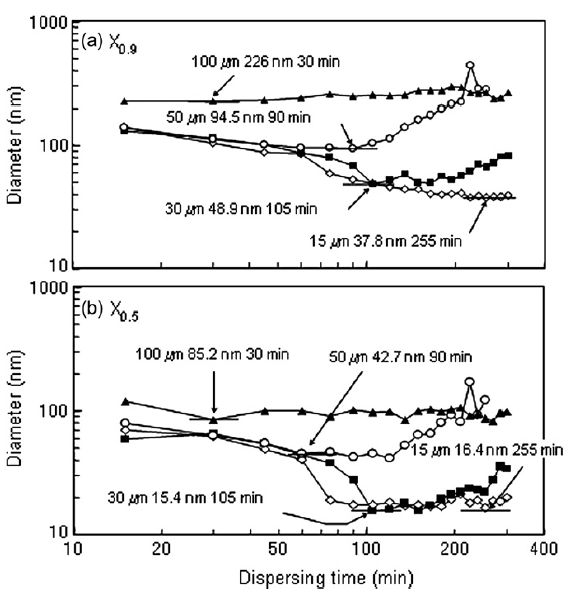
Fig.4 X0.5 and X0.9 for nanoparticle size distributions as function of dispersing time.
| Example No. |
Bead diameter (μm) |
Bead number conc. [ ] |
Dispersing power (kW) |
Dispersing power for a single bead (μW) |
Ratio of impulsive power for a single bead |
|---|---|---|---|---|---|
| 1 2 3 4 |
15 30 50 100 |
4.7×10⁹ 5.9×10⁸ 1.3×10⁸ 1.6×10⁷ |
0.21 0.22 0.23 0.36 |
0.043 0.36 1.83 22.6 |
1 8 42 523 |
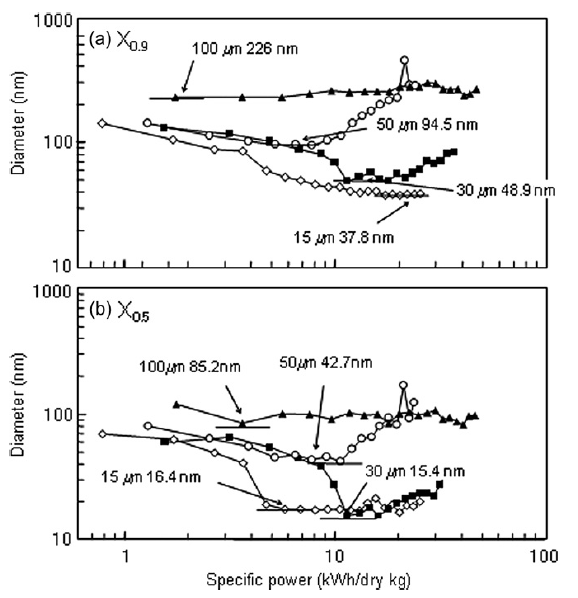
Fig.5 X0.5 and X0.9 for nanoparticle size distributions as function of specific power.
3.2. Nanoparticle characterization
Fig. 6 shows the XRD patterns of the titania nanoparticles for all tested bead sizes. In general, the larger beads had a greater effect on the crystallinity of the nanoparticles. Fig. 7 shows the half width value of the major peak in the XRD pattern as a function of specific power. The half width increased slightly with increasing specific power for all beads, and greater increases occurred for larger sized beads. Smaller beads, therefore, had less effect on particle crystallinity than larger beads, because collisions between nanoparticles and smaller beads have less impact energy.
Fig. 8 shows the TEM images of nanoparticles before beads milling and after a dispersing time of 300 min. Prior to milling, agglomerated titania nanoparticles with dimensions from 200 to 300 nm were observable, and primary titania particles were rod-shaped. After dispersion with 15 and 30 μm beads, unagglomerated primary particles were visible with their rod-shaped morphology conserved. 50 and 100 μm beads had little effect on the size of the nanoparticle agglomerates. Furthermore, the primary particles appeared to have undergone a morphology change from rod-shaped to more spherical when 100 μm beads were used. This agrees well with the XRD patterns and shows that larger beads were not only incapable of breaking up nanoparticle agglomerates, but also nanoparticle structure and morphology was altered during milling with larger beads.
The measured UV–vis spectra of the titania particles in suspension at the time of minimum particle size distribution for each bead size is shown in Fig. 9. UV–vis Spectra agreed well with measured size distributions, i.e. smaller beads were able to fully disperse nanoparticles and therefore greater light transmittance through the nanoparticle suspension was possible when smaller beads were used.
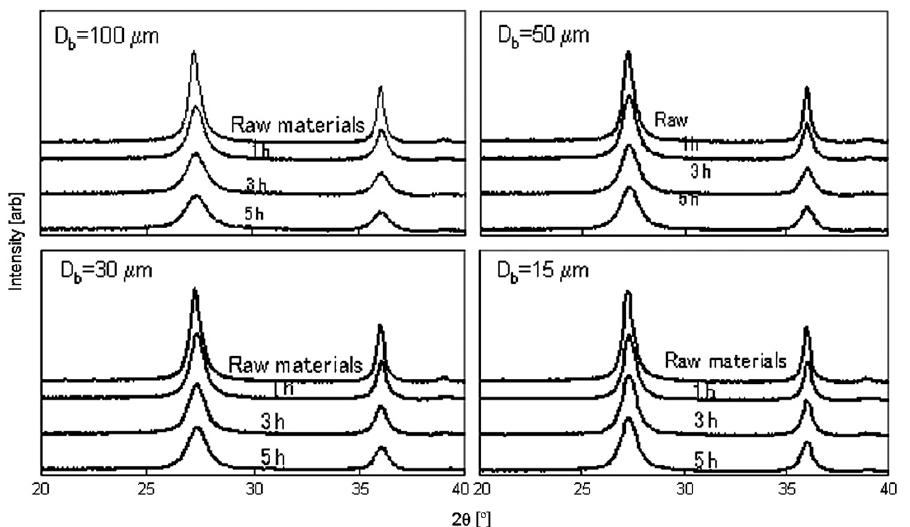
Fig.6 XRD patterns of the dispersed titania particles.
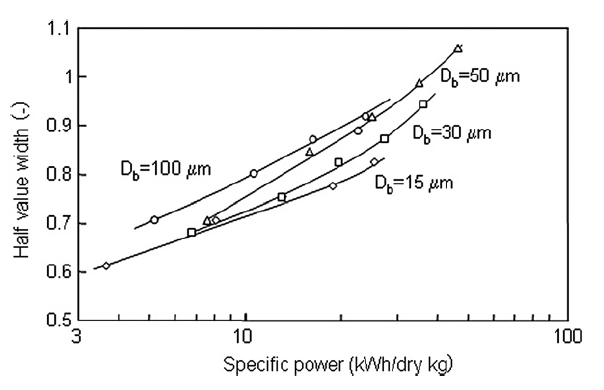
Fig.7 XRD pattern half widths as a function of specific power.
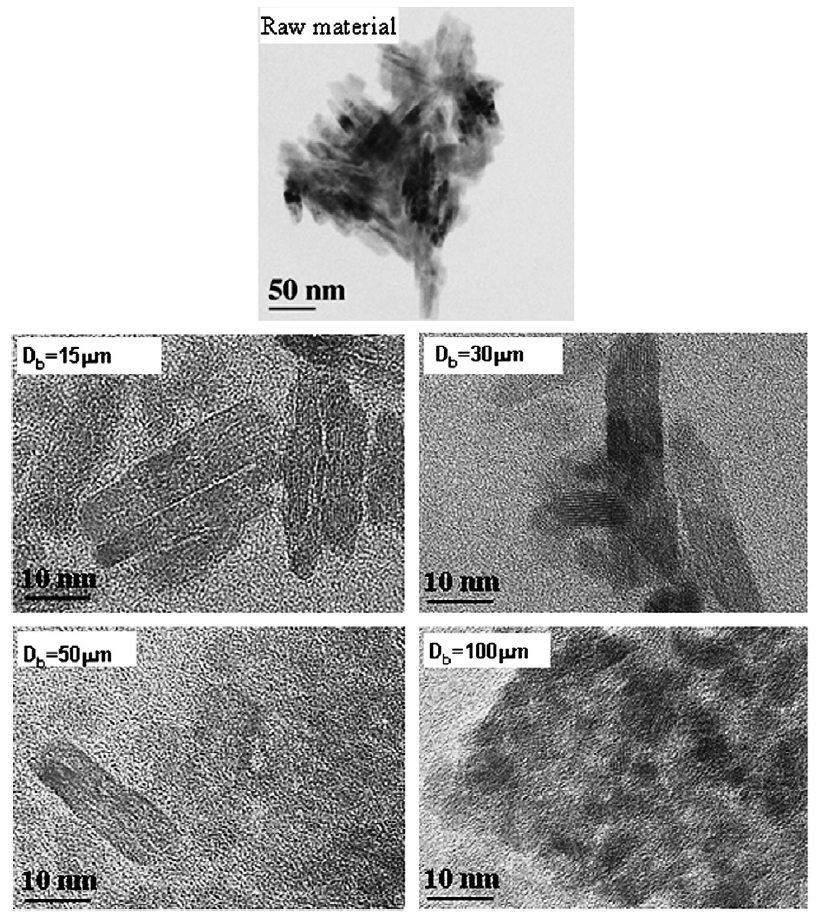
Fig.8 TEM images of TiO2 particles after dispersion using various bead sizes.
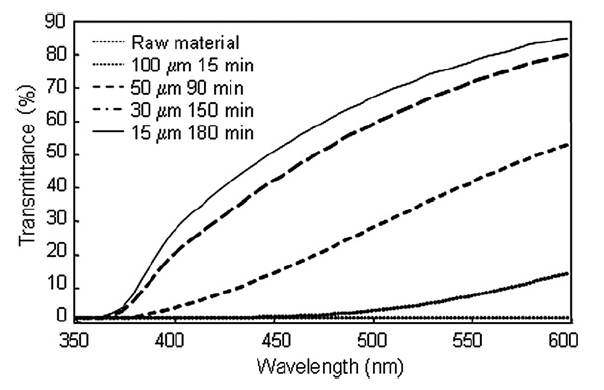
Fig.9 UV–vis spectra of nanoparticles for different bead sizes and dispersing times.
4. Beads contamination
Bead breakage would result in fragments which could not be removed from the nanoparticle slurry and would end up contaminating the slurry. In addition, an unsuccessful centrifugation process would allow for smaller beads themselves to remain in and contaminate the slurry. The concentration of zirconium in the nanoparticle slurry was measured using ICPS. After a dispersing time of 15 min, 1400 ppm of zirconium was found in the nanoparticle slurry with 100 μm beads. For 15 μm beads with the same dispersing time, 220 ppm of zirconium was detected, which implies that the larger beads were more likely to break during the milling process and that the centrifugation process was able to separate the smaller beads from the nanoparticle slurry. A similar result on large bead breakage was reported by Yoden and Itoh [11], i.e. because larger beads have higher impact energies during collisions, they are more likely to fragment.
5. Conclusions
Beads milling with centrifugation in a newly developed beads mill allowed for the use of beads as small as 15 μm in diameter. The smaller beads were capable of dispersing nanoparticles with primary particle sizes of 15 nm that were originally highly agglomerated. No additional chemical treatments or surface modifications were necessary to create a stable nanoparticle dispersion. In addition to being able to create stable dispersions, smaller beads require less specific power to fully disperse nanoparticles. The lower impact energy of smaller beads during bead–nanoparticle collisions minimized the effect that the milling process had on nanoparticle morphology and crystallinity. Furthermore, smaller beads were less likely to break and contaminate the nanoparticle slurry during the milling process. With the importance of nanoparticles in almost all scientific disciplines and industries, this type of beads mill, which is capable of dispersing nanoparticles without chemical treatment, will have many applications.
Acknowledgments
The authors thank Dr. Eishi Tanabe fromWestern Hiroshima Prefecture Industrial Research Institute, for TEM measurements. C.J.H. acknowledges support from an NSF Graduate Research Fellowship.
References
- A.P. Alivisatos, Science 271 (1996) 933–937.
- F. Muller, W. Peukert, R. Polke, F. Stenger, Int. J. Miner. Process. 74 (2004) S31–S41.
- J. Israelachvili, Intermolecular and Surface Forces, London, Academic Press, 2000.
- C. Artelt, H.J. Schmid, W. Peukert, J. Aerosol Sci. 36 (2005) 147–172.
- J. Brant, H. Lecoanet, M. Hotze, M. Wiesner, Environ. Sci. Technol. 39 (2005) 6343–6351.
- J.L. Deiss, P. Anizan, S. El Hadigui, C. Wecker, Colloids Surf. A Physicochem. Eng. Aspects 106 (1996) 59–62.
- E. Tang, G. Cheng, Z. Ma, X. Pang, Q. Zhao, Appl. Surf. Sci. 252 (2006) 5227–5232.
- F. Iskandar, L. Gradon, K. Okuyama, J. Colloid Interface Sci. 265 (2003) 296–303.
- J.F. de la Mora, I.G. Loscertales, J. Fluid Mechan. 260 (1994) 155–184.
- R.B. Mckay, Technological Applications of Dispersion, Dekker, New York, USA, 1994.
- H. Yoden, J. Itoh, J. Soc. Powder Technol. Jpn. 41 (2004) 457–464.
- L. Mangolini, E. Thimsen, U. Kortshagen, Nano Lett. 5 (2005) 655–659.
- L. Madler,W.J. Stark, S.E. Pratsinis, J. Appl. Phys. 92 (2002) 6537–6540.
- A. Kwade, Powder Technol. 105 (1999) 14–20.
- F. Muller, R.F. Polke, Powder Technol. 105 (1999) 2–13.
- T. Iwasaki, J.H. Kim, M. Satoh, Chem. Eng. Sci. 61 (2006) 1065–1073.
- T. Iwasaki, M. Satoh, T. Takahashi, Powder Technol. 119 (2001) 95–101.
- W. Peukert, H.C. Schwarzer, F. Stenger, Chem. Eng. Process. 44 (2005) 245–252.
- W. Peukert, Int. J. Miner. Process. 74 (2004) S3–S17.
- H.C. Schwarzer, W. Peukert, Chem. Eng. Sci. 60 (2005) 11–25.
- A.N. Shipway, E. Katz, I. Willner, Chem. Phys. Chem. 1 (2000) 18–52.
- M. Inkyo, T. Tahara, J. Soc. Powder Technol. Jpn. 41 (2004) 578–585.
- S. Vemury, S.E. Pratsinis, J. Aerosol Sci. 26 (1995) 175–185.
- S.K. Friedlander, Smoke, Dust, and Haze, Oxford Univ. Press, New York, 2000.

